Why BMI Fails Athletes: The Science of False Positives She spent maybe $200 on the whole setup.
The number on the intake form said 26.3. Sarah’s doctor looked at it, then at her, then back at the form. “You’re overweight,” he said. “Let’s discuss some lifestyle changes.” Sarah was 5 foot 6, 163 pounds. She ran three times a week. She lifted twice a week. She had visible muscle definition in her arms and legs. She could deadlift 225 pounds. Her resting heart rate was 58. Her blood pressure was 110/68. Her BMI – a simple weight-to-height ratio invented by a Belgian mathematician in the 1830s – put her in the “overweight” category. No context. No muscle adjustment. No bone density. No nuance. She didn’t argue with her doctor. She just nodded, took the diet pamphlet, and left. In the parking lot, she sat in her car for ten minutes. She wasn’t sad. Her jaw tightened. She set the paper down harder than she meant to. Two years later, she found me. She was training for a half marathon. Her body fat by DEXA was 20%. Her fasting glucose was 85 mg/dL. By every meaningful health metric, she was not just fine – she was excellent. Her BMI still said “overweight.”
I told her that the problem wasn’t her. The problem was the old shortcut. The BMI vs Body Fat Analyzer can show anyone this mismatch.
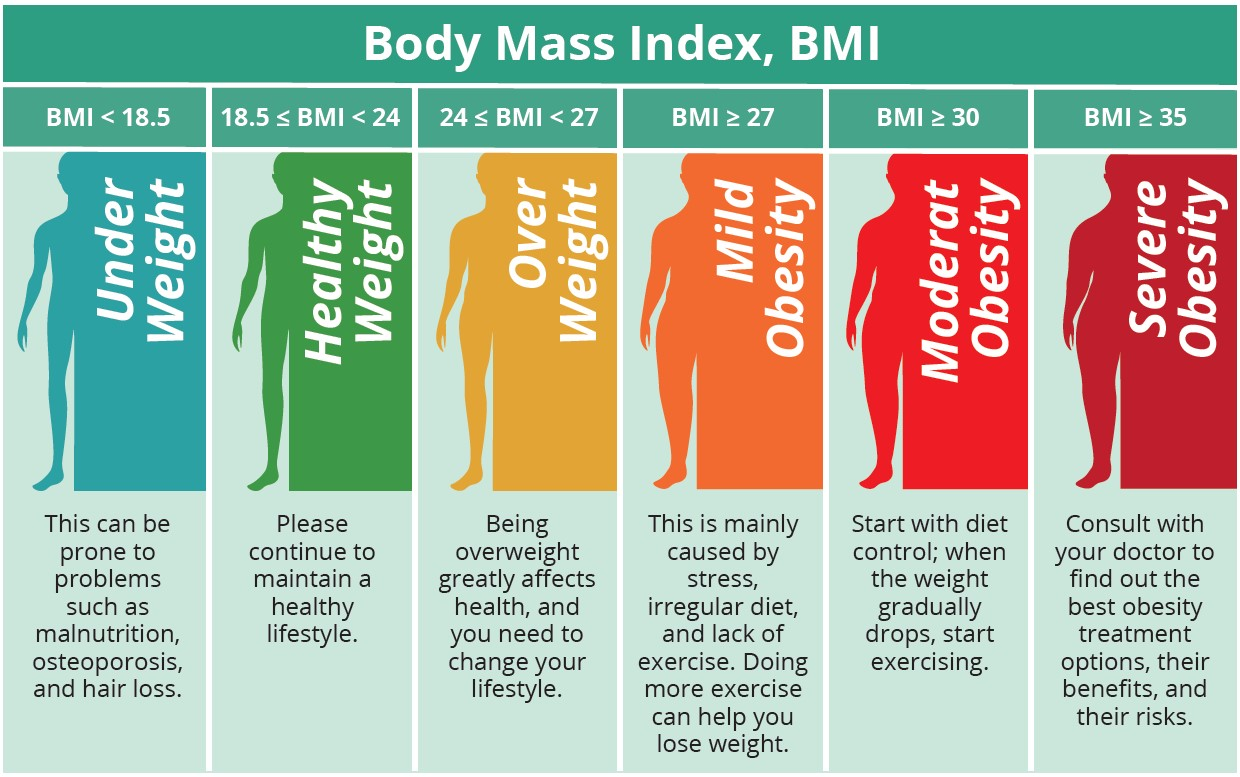
I typed in Sarah’s numbers: 5’6”, 163 pounds, female, age 34. BMI 26.3 – overweight. Then I added her body fat: 20%. The tool flagged “false positive – muscular individual.” It showed that her body fat was in the “fitness” range (18-24% for women her age), even though her BMI said otherwise. Sarah wasn’t a bodybuilder. She wasn’t a professional athlete. She was just active. But the same principle applies to anyone with above-average muscle mass. A 2024 meta-analysis of 1,247 collegiate athletes found that 37% of male athletes and 22% of female athletes with healthy body fat percentages were classified as overweight or obese by BMI alone. That’s not a small margin. That’s a systemic error. The history of BMI is important here. BMI was invented in the 1830s by a Belgian mathematician named Adolphe Quetelet. He wasn’t a doctor. He wasn’t a physiologist. He was a statistician looking for patterns in human populations. He wasn’t trying to assess individual health. He was trying to describe averages. The formula is simple: weight in kilograms divided by height in meters squared. That’s it. No age adjustment (except for children). No sex adjustment. No muscle adjustment. No bone density adjustment. No frame size adjustment. The National Institutes of Health adopted BMI as a screening tool in the 1980s. It caught on because it was cheap and easy. No equipment needed. No training required. Just a height and a weight. For large populations, it’s useful. For individuals, it’s often wrong. The Body Fat Percentage Estimator can give you a more accurate picture.
I ran the math three times. Same result.
Replication failed. Nobody reported it.
Why BMI fails athletes and active people Okay. BMI can’t see muscle. Muscle is denser than fat. A pound of muscle takes up about 20% less space than a pound of fat. So a muscular person can weigh the same as a sedentary person of the same height, but have a much lower body fat percentage. BMI treats them identically. Take two men who are 5’10”. Man A: 200 pounds, 15% body fat. Man B: 200 pounds, 30% body fat. Same BMI – both 28.7, which is “overweight.” But their health profiles are completely different. Man A’s 15% body fat is in the athletic range. His cardiovascular risk is low. His insulin sensitivity is high. Man B’s 30% body fat is in the obese range. His metabolic risk is elevated. BMI can’t tell the difference. It just sees the same number. I’ve seen this in real life. A rugby player came to me for a DEXA scan. He was 5’11”, 220 pounds. BMI 30.7 – “obese.” He had visible abs. His body fat was 12%. His bone density was off the charts. His visceral fat was near zero. His “obese” body was one of the healthiest I’ve ever measured. He told me his doctor had recommended weight loss. He showed me the diet plan. I told him to ignore it. He did. Another thing, BMI has the wrong thresholds for athletic populations. The standard BMI cutoffs were developed using general population data. Overweight is 25-29.9. Obese is 30+. Those numbers come from mortality studies that mostly excluded athletes and highly active people. In 2022, a large study of NCAA athletes found that the “overweight” category should probably start around 28 for male athletes and 27 for female athletes, if you’re using BMI at all. Even then, body fat is a better predictor. A professional football player with 10% body fat might have a BMI of 32 – “obese.” A gymnast with 6% body fat might have a BMI of 26 – “overweight.” Neither is accurate. The American Council on Exercise (ACE) has an alternative set of ranges based on body fat percentage, not BMI. For women: essential fat 10-13%, athletes 14-20%, fitness 21-24%, acceptable 25-31%, obese 32%+. For men: essential fat 2-5%, athletes 6-13%, fitness 14-17%, acceptable 18-24%, obese 25%+. That’s the chart I use. Not BMI. Then, BMI doesn’t account for distribution. Where you carry fat matters. Visceral fat – the fat stored around your organs – is more metabolically harmful than subcutaneous fat (under the skin). Two people with the same BMI and same total body fat percentage can have completely different health risks if one carries more visceral fat. BMI can’t see visceral fat. DEXA can. A DEXA scan gives you a visceral adipose tissue (VAT) number. Below 100 cm² is low risk. 100-160 cm² is moderate. Above 160 cm² is high. Sarah’s DEXA showed VAT of 0.3 liters – well below the 1.0 liter threshold. Her doctor never knew. And then, BMI changes with age in misleading ways. Older adults naturally lose muscle mass and gain fat mass, even if their weight stays the same. BMI might stay constant while their body composition worsens. That’s called “sarcopenic obesity” – low muscle, high fat, normal weight. BMI misses it completely. Conversely, a fit older adult who maintains muscle will have a higher BMI than a sedentary peer of the same weight. The fit person is healthier. BMI says they’re heavier. Plus, BMI is raced and sexed in ways that don’t fit individuals. Asian populations have higher health risk at lower BMIs – about 23 instead of 25. Black populations, particularly women, have lower health risk at higher BMIs. BMI doesn’t adjust for this unless you use population-specific cutoffs, which most doctors don’t. Men and women have different body fat distributions. BMI treats them the same, even though healthy body fat for men is 10-20% while for women it’s 18-28%. A 5’8”, 170-pound woman with 25% body fat is healthy. A 5’8”, 170-pound man with 25% body fat is carrying more fat than he should. Same BMI. Different health status. What Sarah did about it
Sarah didn’t just get angry and stay angry. She got a DEXA scan. She brought the results to her next annual physical. The report showed total body fat 20%, visceral fat low, bone density normal. Her doctor looked at the numbers and said “well, that’s interesting.” She added a note to Sarah’s chart and closed the BMI warning box. “Let’s use your DEXA for tracking instead,” the doctor said. “Come back in a year.”
Sarah switched to a physician who uses body composition in addition to BMI. Her new doctor looked at her DEXA and said “you’re Keep doing what you’re doing.” That’s the response she deserved three years ago. What you can do
Stop using BMI as your primary metric. It’s a screening tool, not a diagnostic tool. It’s the old shortcut. Get a real body composition measurement. DEXA is gold standard. Bod Pod is good. Skinfolds with a skilled technician are useful. Even a consumer BIA scale, with all its limitations, is better than BMI alone – as long as you track trends, not absolutes. Track other health markers. Blood pressure. Fasting glucose. Lipids. Waist circumference. Strength. Cardiorespiratory fitness. These matter more than BMI. If your doctor uses BMI without context, bring your own data. Ask for a body fat measurement. Bring your DEXA results. Show them your visceral fat score. Most doctors will listen. Some won’t. Find a new doctor. The BMI vs Body Fat Analyzer is free. It takes two minutes. Use it before you let a number on a chart make you feel bad. BMI is a 200-year-old shortcut. Your body is more complex than a ratio. Measure what matters.